Modern Circle Diagram Template for PowerPoint
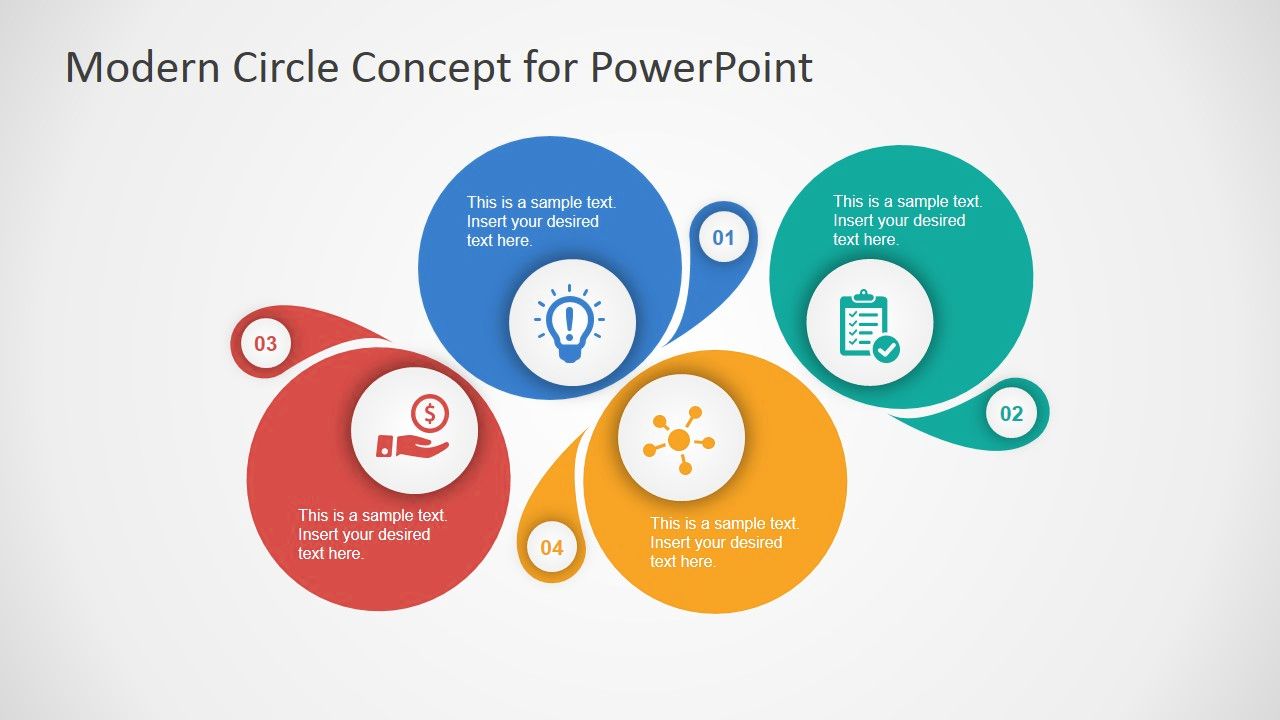
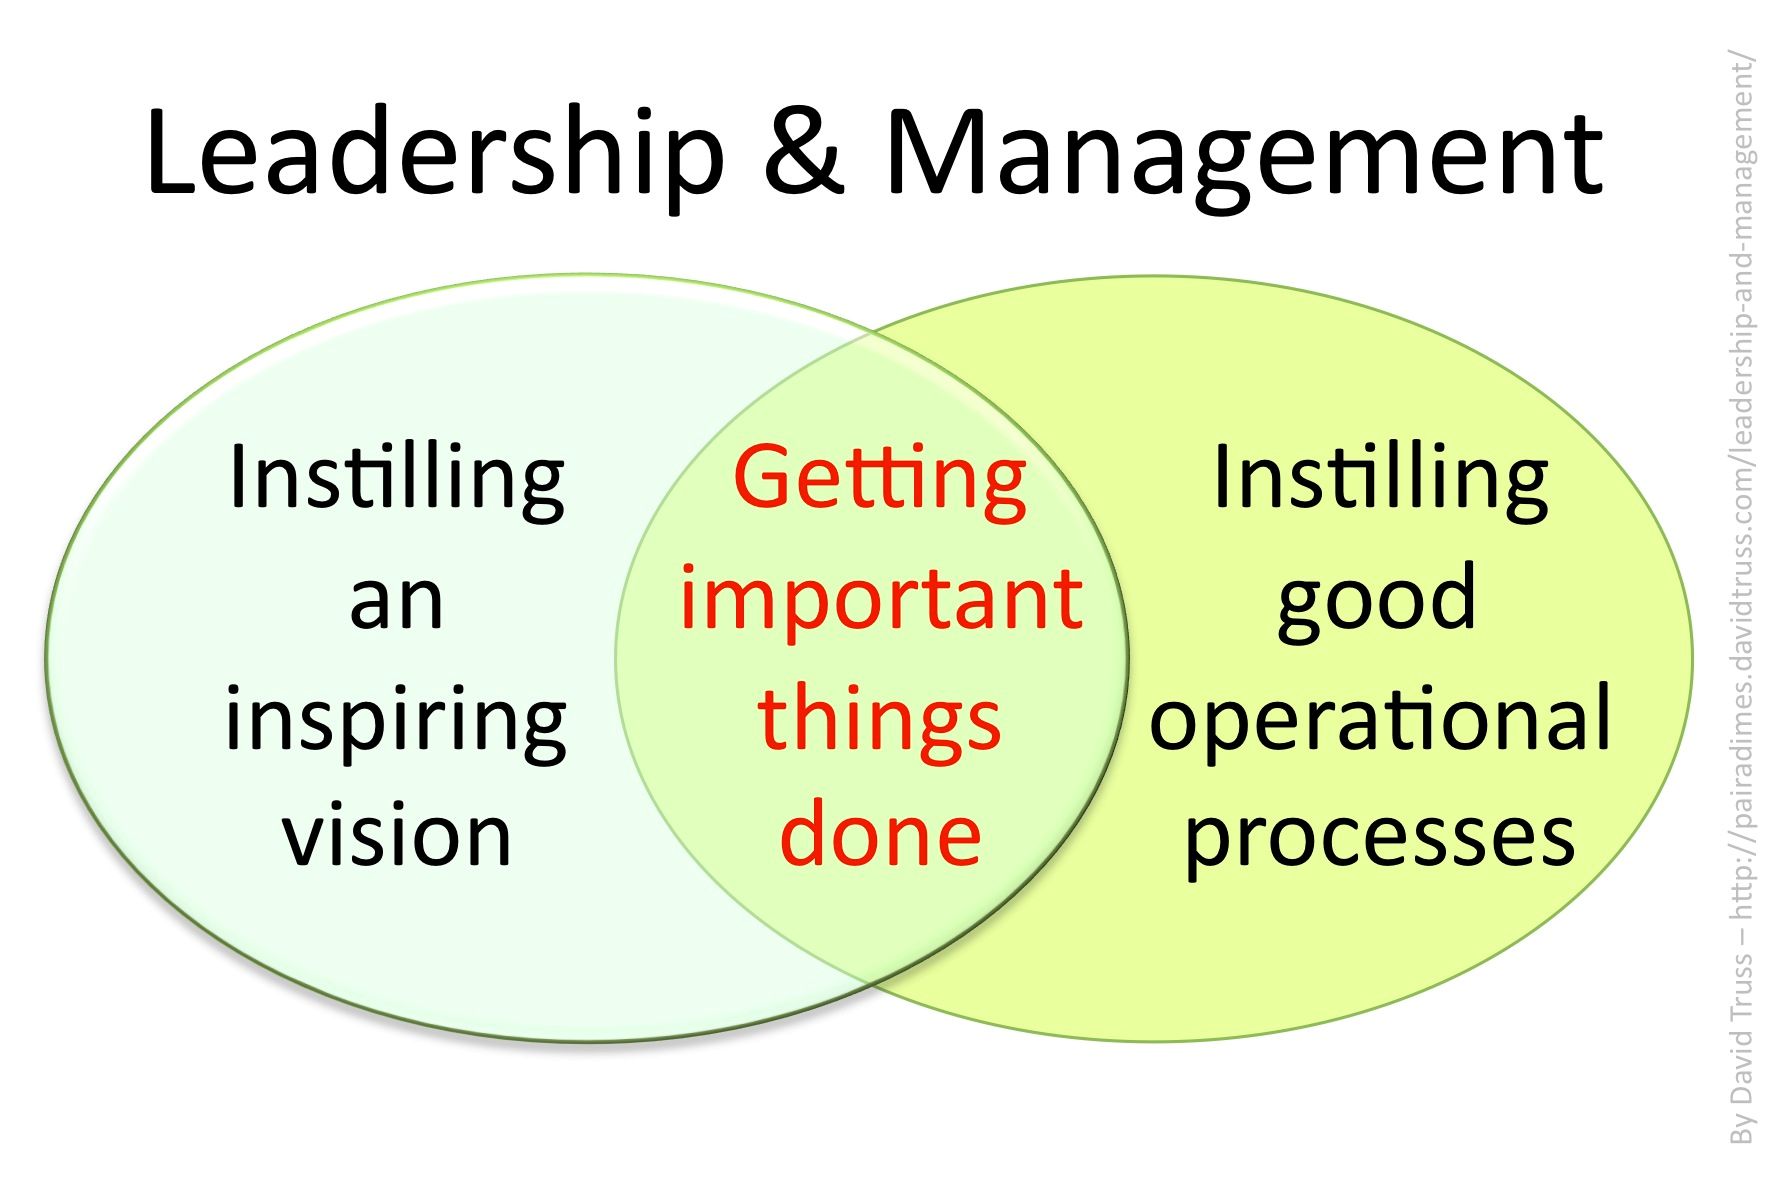
Modern Circle Diagram Template for PowerPoint: A sleek and professional circle diagram template helps visualize processes, cycles, or relationships in a clean, modern layout. Its commonly used to represent interconnected concepts such as continuous improvement, feedback loops, or leadership attributes. With fully editable elements, its suitable for business reports, marketing strategies, or educational materials that require visual clarity and engagement.